Project integration with Lighthouse CI: Quality control for every PR

by Hsuan Huang
Use LighthouseCI GitHub Action to automatically check website quality, SEO, and improvement suggestions

In modern front-end development, website performance, SEO, and accessibility are becoming increasingly important. Using Lighthouse for testing has become a common practice, and the official site provides detailed, step-by-step guides to help you monitor them.
Therefore, the following will not focus on explaining the meaning of each metric or how to improve them, but will instead focus on Lighthouse CI — specifically, how I use Lighthouse CI and GitHub Actions in a Next.js project to automatically generate Lighthouse reports for every Pull Request, along with my personal insights.
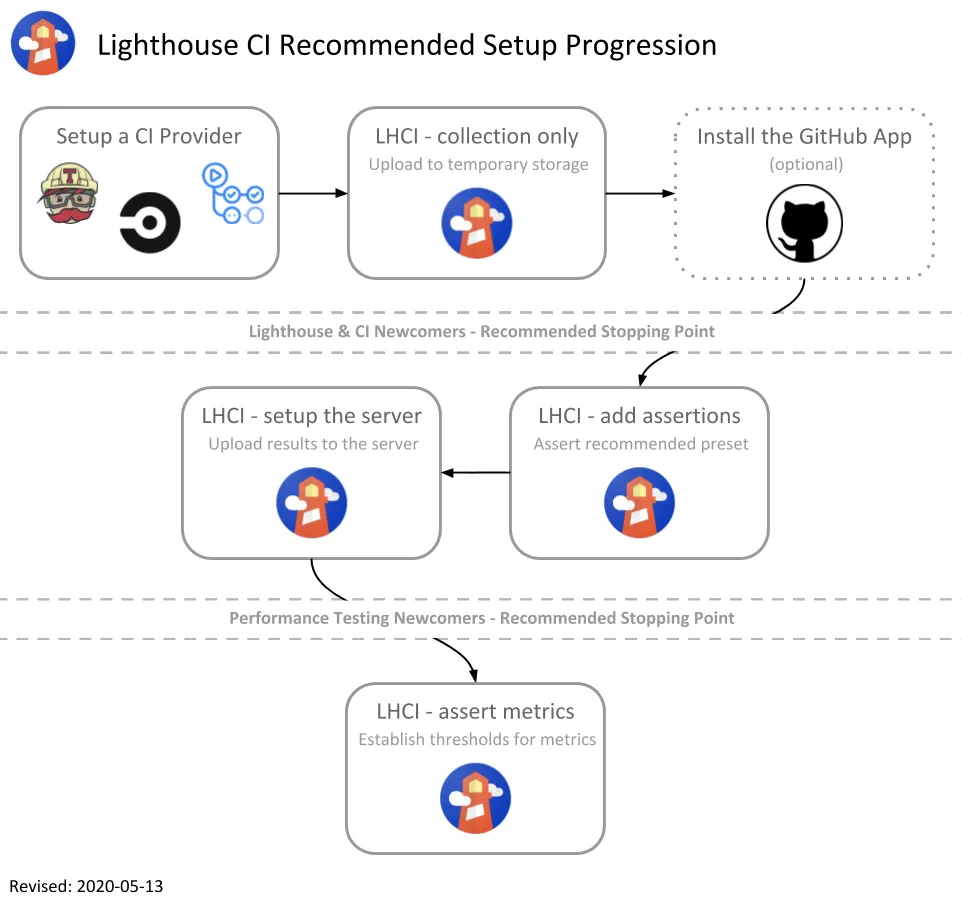
For those who are not familiar with CI, you can check this out.👈🏻👈🏻
🚀 Why do this?
Why do it matters: time and energy are traded, so know the value. We’re an e-commerce platform, and SEO is critical. Manually running scores while shipping new features is tedious; I want an easier way to monitor (or I’m just lazy?).
Also, tracking metric score changes for every commit is very appealing to me.
📡 Since we’re talking GitHub Actions, it’s time to start writing the workflows/YAML
name: Light House CI
on: [push]
jobs:
lighthouseci:
runs-on: ubuntu-latest
environment: lhci
env:
NEXTAUTH_URL: http://localhost:3000
NEXTAUTH_SECRET: ${{ secrets.NEXTAUTH_SECRET }}
steps:
- uses: actions/checkout@v3
- uses: actions/setup-node@v3
with:
node-version: 22
- name: Install pnpm
run: npm install -g pnpm
- name: Install dependencies
run: pnpm install --frozen-lockfile
- name: Build the project
run: pnpm build
- name: Start Next.js server
run: pnpm start &
- name: Wait for server to be ready
run: |
for i in {1..30}; do
curl -sSf http://localhost:3000 && break
sleep 1
done
- name: Check server response
run: curl -I http://localhost:3000
- name: Run Lighthouse CI
env:
LHCI_GITHUB_APP_TOKEN: ${{ secrets.LHCI_GITHUB_APP_TOKEN }}
run: npx @lhci/cli@0.13.x autorun --collect.url=http://localhost:3000 || echo "Lighthouse CI failed😮💨, but this is not a blocking error."
Basically, on every PR, GitHub automatically builds on a cloud VM (runner), checks out the code, installs Node v3 (chosen for stability), installs dependencies, runs tests, and performs various checks, running on its port:3000.
Note that anything like ${{ secrets.LHCI_GITHUB_APP_TOKEN }} refers to secret values stored in your GitHub repo, usually sensitive information that shouldn’t be pushed to the project.
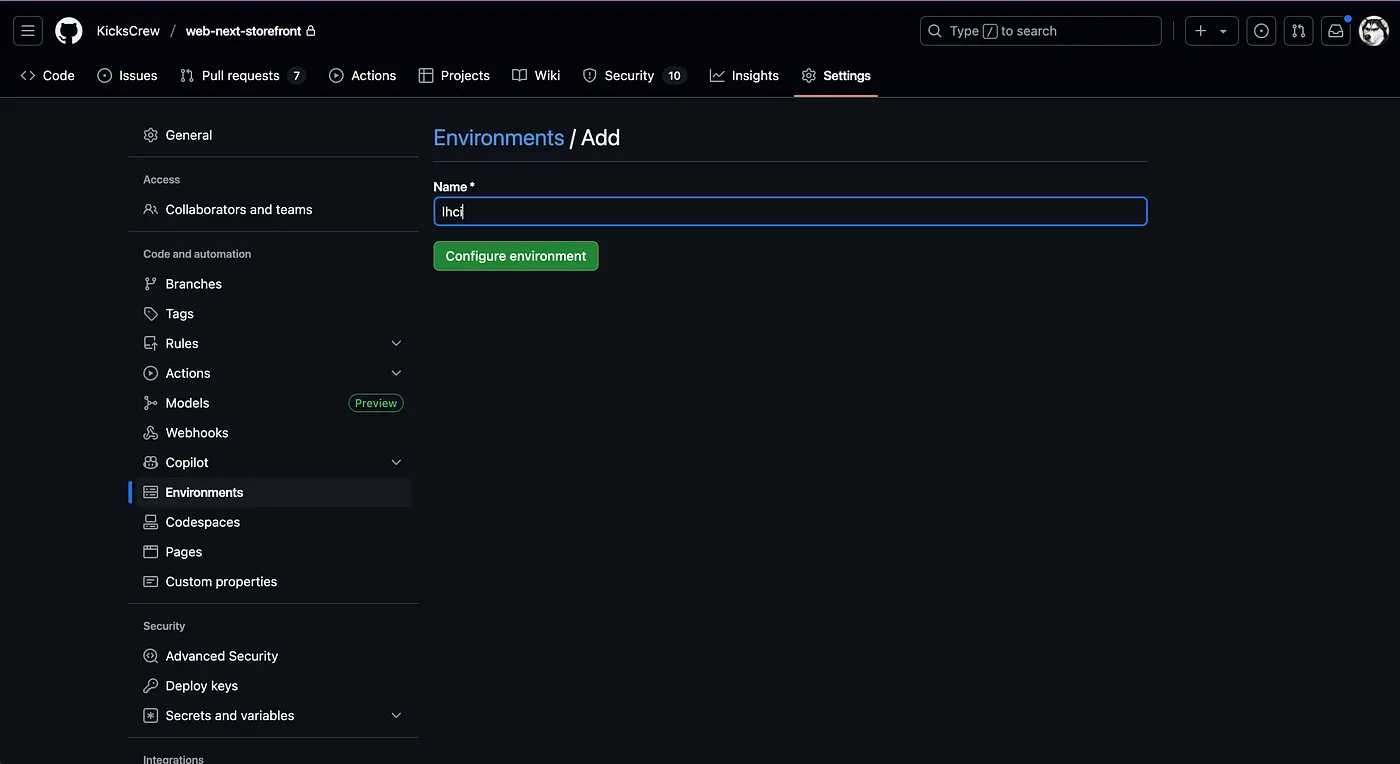

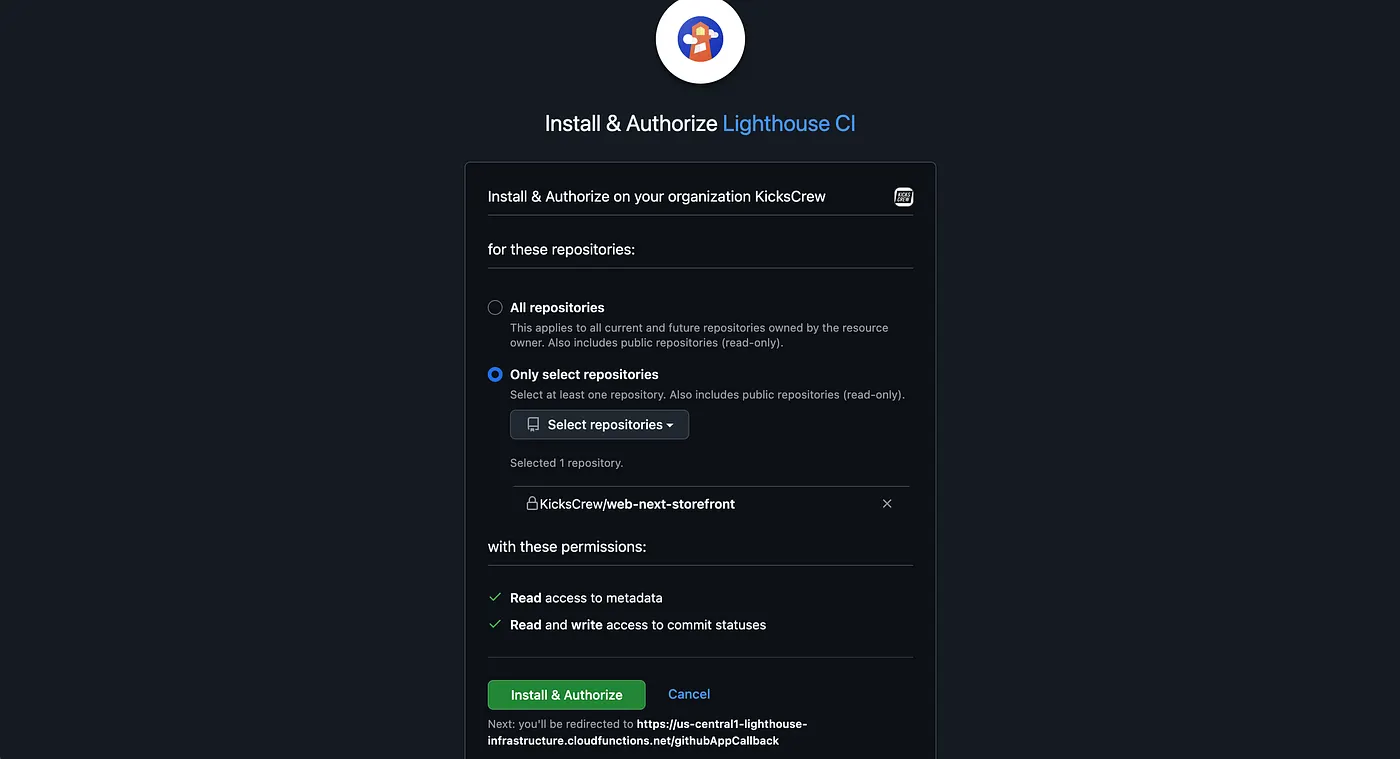
The LHCI_GITHUB_APP_TOKEN here is obtained from Lighthouse.
📡 Next, let’s create the **.lighthouserc.json** file
{
  "ci": {
    "collect": {
      "url": ["http://localhost:3000/"]
    },
    "assert": {
      "preset": "lighthouse:no-pwa",
      "assertions": {
        "categories:performance": [          "warn",
          { "aggregationMethod": "optimistic", "minScore": 0.9 }
        ],
        "categories:accessibility": [          "error",
          { "aggregationMethod": "optimistic", "minScore": 0.9 }
        ]
      }
    },
    "upload": {
      "target": "temporary-public-storage",
      "artifactName": "lhci-report"
    }
  }
}
This is where you set your standards, choose which metrics to track, and decide how detailed the checks should be. Here, I set the basic performance and accessibilityscores to 90; anything below triggers a warning but doesn’t block the merge. For more options, refer to the official configuration.md.
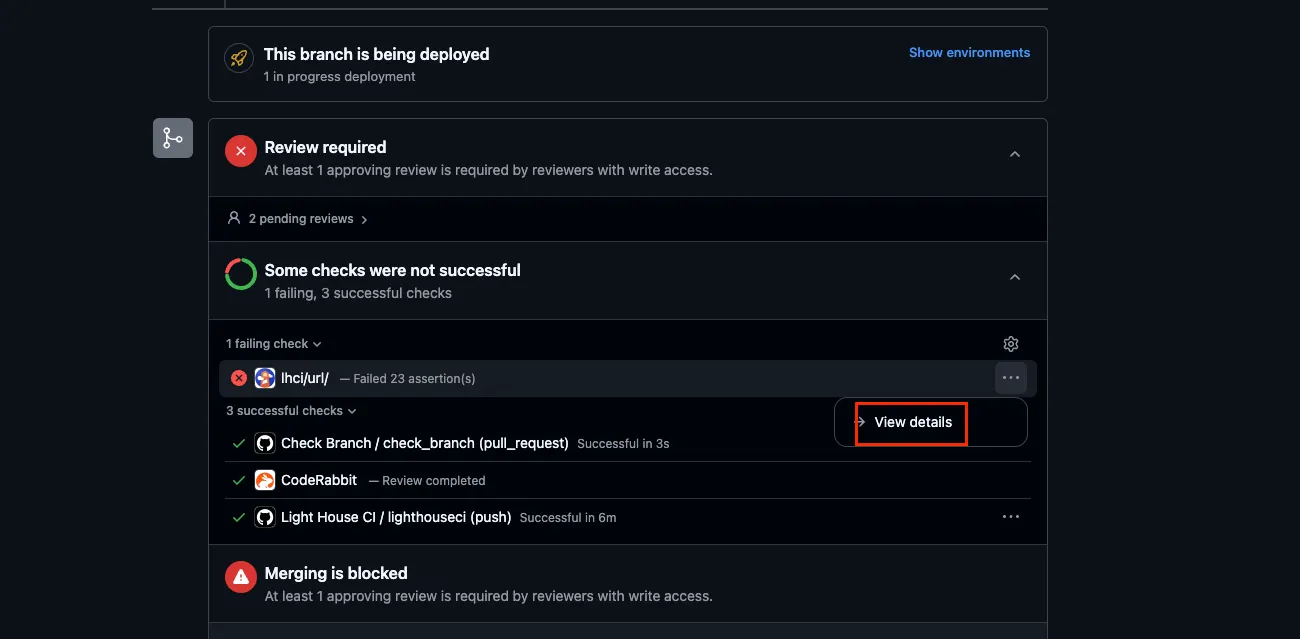
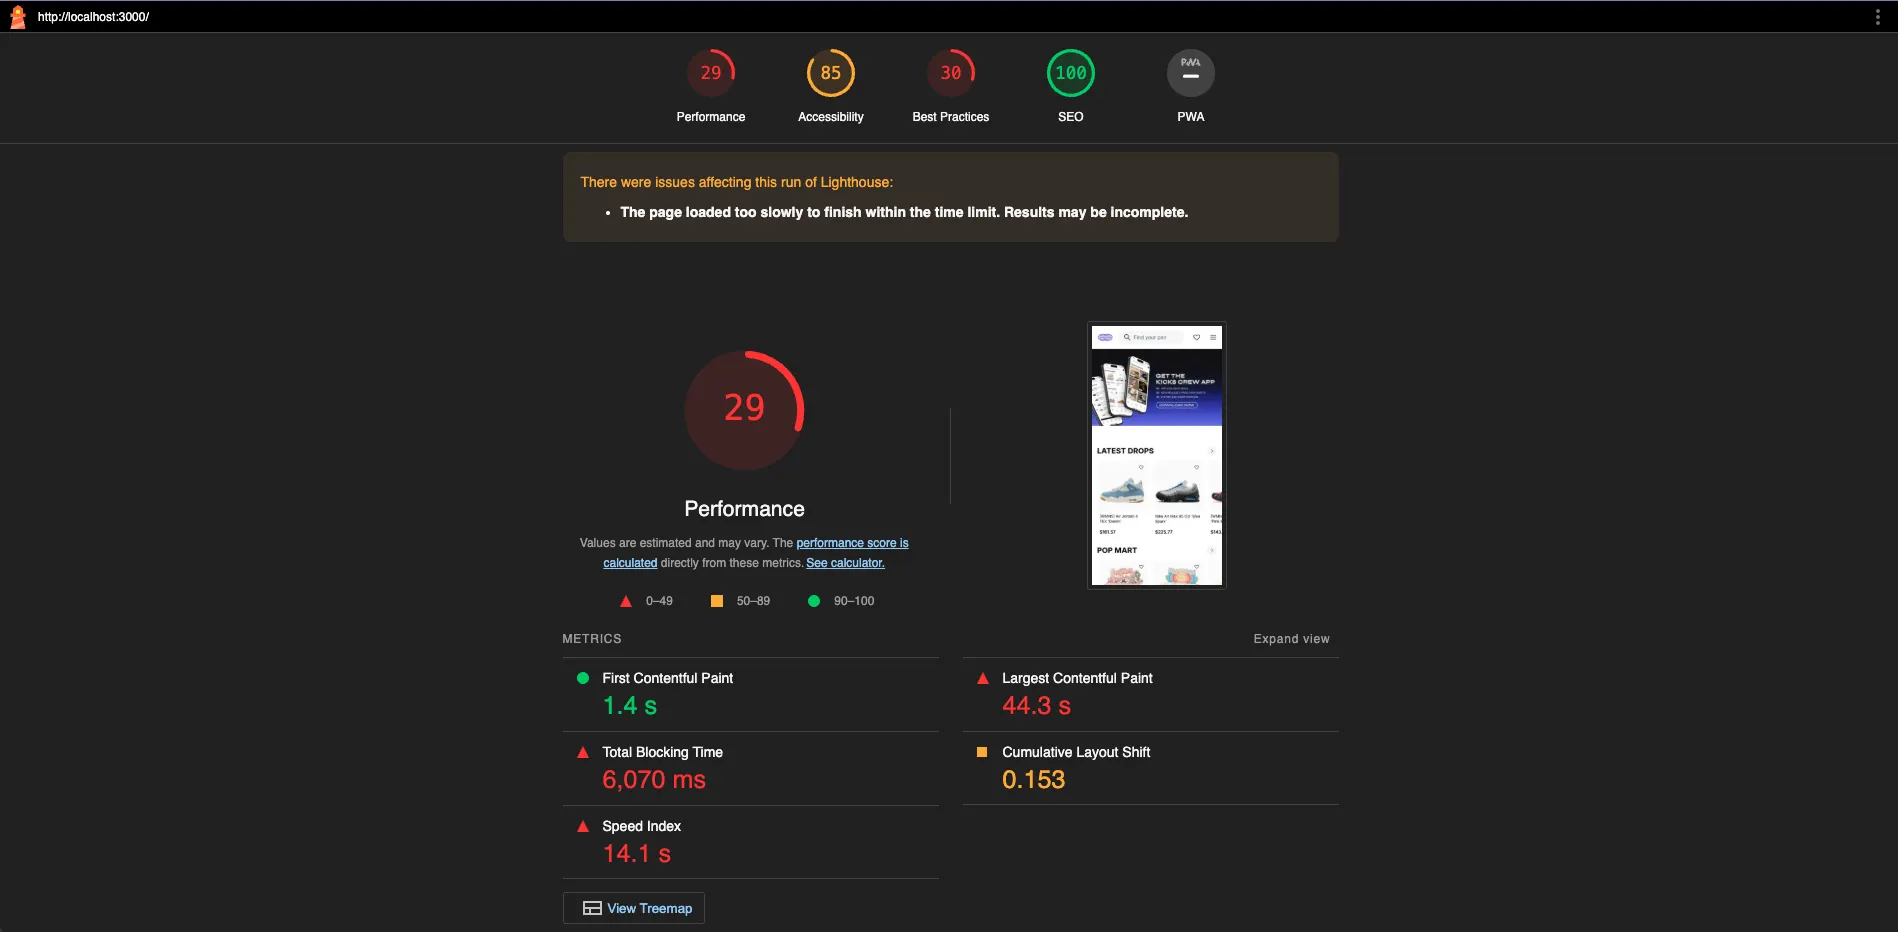
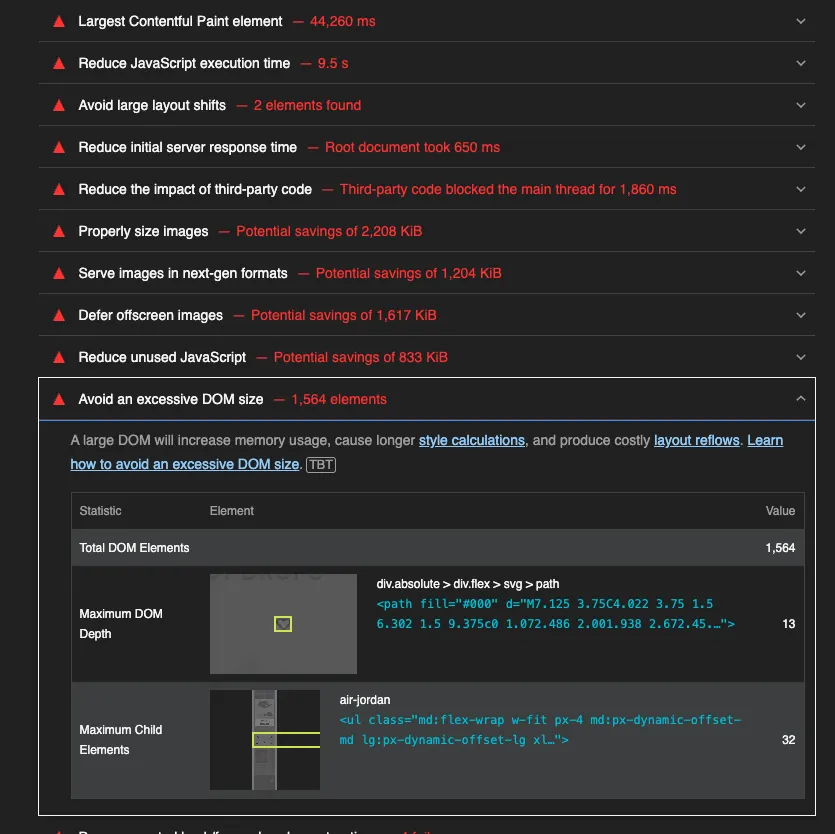
Once done, you can actually see a small lighthouse icon in the CI/CD check section at the bottom of each PR. Click “View details” to see the report and detailed improvement suggestions.
🫠 Challenges during the process…
Actually, writing it wasn’t very long in terms of content, but it took 1–2 weeks of trial and error. The biggest issue was that most reference articles were from the CSR era; there are relatively few for SSR. Previously, SPA/CSR workflows were simpler: after building, static files are generated, and Lighthouse can test them via a static server.
With SSR, you need to start a Node.js server, wait for it to be ready, and then have Lighthouse test it. This also requires authentication, since Lighthouse must send requests to the server to capture the real SSR page content.
All of this came from continuous experimentation, testing, and discussing with GPT. At first, I truly had no idea how to write the Lighthouse YAML for SSR. I got stuck multiple times, and staring at the failing logs made me want to smash my screen (?).
🚀 Actually, I feel…
Although the scores weren’t optimistic at first — especially as development pace increased, team size grew, and other uncontrollable factors came in — once the project scaled up, scores naturally dropped if not carefully managed from the start.
From here on, it’s better to focus on the relative score changes for each PR rather than absolute scores, so you can identify which part of the code might be dragging down the score and stay informed.
🔖 References